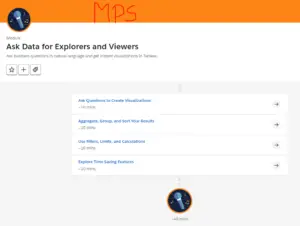
Ask Data for Explorers and Viewers -Trailhead salesforce quiz. Ask business questions in natural language and get instant visualizations in Tableau.
#1 Ask Questions to Create Visualizations
+100 points
Q1) Before you can use Ask Data, what must a Tableau author create?
#I) A dashboard
#II) A lens
#III) A sheet
#IV) A workbook
[bg_collapse view=”button-green” color=”#4a4949″ expand_text=”Show Answers” collapse_text=”Hide Answers” ]
A lens [/bg_collapse]
Q2) What do you click to send your Ask Data vizzes to others via email, Slack, or a link?
#I) Clear
#II) Delete
#III) Duplicate
#IV) Share
[bg_collapse view=”button-green” color=”#4a4949″ expand_text=”Show Answers” collapse_text=”Hide Answers” ]
Share [/bg_collapse]
Check the Quiz to Earn 100 Points
The second attempt earns 50 points. Three or more earn 25 points.
#2 Aggregate, Group, and Sort Your Results
Quiz
+100 points
Q1) You ask: “How many unique products do we sell?” How is the answer aggregated?
#I) By Product ID
#II) Count
#III) Distinct Count
#IV) Sum
[bg_collapse view=”button-green” color=”#4a4949″ expand_text=”Show Answers” collapse_text=”Hide Answers” ]
Distinct Count [/bg_collapse]
Q2) You ask: “What were Sales by Product from highest to lowest?” In which order are the results sorted?
#I) Alphabetical
#II) Ascending
#III) Data Source Order
#IV) Descending
[bg_collapse view=”button-green” color=”#4a4949″ expand_text=”Show Answers” collapse_text=”Hide Answers” ]
Descending [/bg_collapse]
Check the Quiz to Earn 100 Points
The second attempt earns 50 points. Three or more earn 25 points.
#3 Use Filters, Limits, and Calculations
Quiz
+100 points
Q1) You ask: “What were the top 5 best-selling products?” What is this question an example of?
#I) Applying limits
#II) Filtering by a date
#III) Filtering by a dimension
#IV) Filtering by a measure
[bg_collapse view=”button-green” color=”#4a4949″ expand_text=”Show Answers” collapse_text=”Hide Answers” ]
Applying limits [/bg_collapse]
Q2) Your visualization displays a 10% increase in sales from this January to this February. Which function did you most likely use in your question?
#I) Month-over-month difference
#II) Month-over-month % difference
#III) Year-over-year difference
#IV) Year-over-year % difference
[bg_collapse view=”button-green” color=”#4a4949″ expand_text=”Show Answers” collapse_text=”Hide Answers” ]
Month-over-month % difference [/bg_collapse]
Check the Quiz to Earn 100 Points
The second attempt earns 50 points. Three or more earn 25 points.
#4 Explore Time-Saving Features
Quiz
+100 points
Q1) For the Country field, the lens author is allowing people to type USA to refer to the United States. Which has the lens author added to allow this?
#I) A field synonym
#II) A value synonym
#III) A recommended visualization
#IV) An option to contact the lens author
[bg_collapse view=”button-green” color=”#4a4949″ expand_text=”Show Answers” collapse_text=”Hide Answers” ]
A value synonym [/bg_collapse]
Q2) While using Ask Data, you have questions about the underlying data structure and expected results. Which feature should you use to get help?
#I) Field synonym
#II) Value synonym
#III) Specify a visualization type
#IV) Contact the lens author
[bg_collapse view=”button-green” color=”#4a4949″ expand_text=”Show Answers” collapse_text=”Hide Answers” ]
Contact the lens author [/bg_collapse]
Check the Quiz to Earn 100 Points
The second attempt earns 50 points. Three or more earn 25 points.