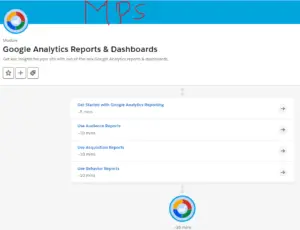
In this article, we will see the solution of the Trailhead Salesforce Module called Google Analytics Reports & Dashboards. After watching this solution you will achieve 100 points which is my guarantee. For more modules, you can click on trailhead salesforce answers.
Get critical insights for your site with out-of-the-box Google Analytics reports & dashboards.
#1. Get Started with Google Analytics Reporting
Solve the Quiz and get +100 points
Q1) How can you change which data is displayed on a card?
#I)Select from a menu of cards
#II)Switch reports
#III)Click the dimensions or metrics on the card
#IV)Scroll across the home page
#V)Click anywhere on the card
[bg_collapse view=”button-green” color=”#4a4949″ expand_text=”Show Answers” collapse_text=”Hide Answers” ] III)Click the dimensions or metrics on the card [/bg_collapse]
Q2) The Google Analytics home page is:
#I)A display of all the ads you are running
#II)A list of your accounts and audiences
#III)Available only once you link to AdWords
#IV)A summary of your site’s vital signs
[bg_collapse view=”button-green” color=”#4a4949″ expand_text=”Show Answers” collapse_text=”Hide Answers” ] IV)A summary of your site’s vital signs [/bg_collapse]
Check the Quiz to Earn 100/100 Points
The second attempt earns 50 points. Three or more earn 25 points.
#2. Use Audience Reports
Solve the Quiz and get +100 points
Q1) Audience Reports are useful for:
#I)Understanding the characteristics of your users
#II)Understanding how to use Google Analytics
#III)Setting goals and monitoring conversions
#IV)Monitoring traffic to your site in real time
[bg_collapse view=”button-green” color=”#4a4949″ expand_text=”Show Answers” collapse_text=”Hide Answers” ] I)Understanding the characteristics of your users [/bg_collapse]
Q2) Google Analytics derives country and city data from:
#I)User survey responses
#II)Third party geo data
#III)Proprietary geo data
#IV)IP address
#V)Google Analytics does not derive country and city data
[bg_collapse view=”button-green” color=”#4a4949″ expand_text=”Show Answers” collapse_text=”Hide Answers” ] V)Google Analytics does not derive country and city data [/bg_collapse]
Check the Quiz to Earn 100/100 Points
The second attempt earns 50 points. Three or more earn 25 points.
#3. Use Acquisition Reports
Solve the Quiz and get +100 points
Q1) You can use Acquisition Reports to:
#I)Monitor website visits in real time
#II)Compare the performance of different marketing channels
#III)View the funnel path of any individual customer
#IV)See your list of acquired websites and apps
[bg_collapse view=”button-green” color=”#4a4949″ expand_text=”Show Answers” collapse_text=”Hide Answers” ] II)Compare the performance of different marketing channels [/bg_collapse]
Q2) Which of the following is referral traffic?
#I)All search traffic
#II)Paid search traffic only
#III)Traffic from other websites
#IV)All traffic except email referrals
#V)There is no such thing as referral traffic
[bg_collapse view=”button-green” color=”#4a4949″ expand_text=”Show Answers” collapse_text=”Hide Answers” ] III)Traffic from other websites [/bg_collapse]
Q3) Which of the following reports can show you traffic from the organic, social, and direct categories?
#I)Channels report
#II)Referrals report
#III)Organic report
#IV)No report would show social
[bg_collapse view=”button-green” color=”#4a4949″ expand_text=”Show Answers” collapse_text=”Hide Answers” ] I)Channels report [/bg_collapse]
Check the Quiz to Earn 100/100 Points
The second attempt earns 50 points. Three or more earn 25 points.
#4. Use Behavior Reports
Solve the Quiz and get +100 points
Q1) Which metric indicates how engaged users were on a site page?
#I)Source/medium
#II)Browser
#III)Bounce rate
#IV)Audience
#V)Real-time
[bg_collapse view=”button-green” color=”#4a4949″ expand_text=”Show Answers” collapse_text=”Hide Answers” ] III)Bounce rate [/bg_collapse]
Q2) Which report can you use to understand the performance of content in a particular directory of your site?
#I)Content Drilldown report
#II)Landing Pages report
#III)Bounce Rate report
#IV)Events report
#V)Audience report
[bg_collapse view=”button-green” color=”#4a4949″ expand_text=”Show Answers” collapse_text=”Hide Answers” ] I)Content Drilldown report [/bg_collapse]
Check the Quiz to Earn 100/100 Points
The second attempt earns 50 points. Three or more earn 25 points.
From here you can directly go to the module called Google Analytics Reports & Dashboards to solve the challenge.
List of Modules:
- The Media Industry
- Module: Content Calendar Planning
- Module: Zero Trust Security In The Cloud 2022
- Module: Amazon Alexa Development Basics
- Module: Application Security Engineer Responsibilities -Trailhead Answers
- Module: Salesforce B2C Commerce Price Books, Product Images, And Content
- Module: Identity Management In Slack
- Module: Public Sector Solutions Design
- Module: Approval Process For Public Sector Solutions
- Module: Business Rules Engine
- Module: Ask Data For Explorers And Viewers
- Module: Industries CPQ Foundations
- Module: Salesforce Mobile App Rollout
- Module: External Services -Trailhead Quiz
